|
Charles Cheng Xia
1009 – 5050
Halifax Street
Burnaby, BC V5B
2N5
T 604 700
7328 E cxmail@yahoo.ca
October 8, 2020
BC
Children’s Hospital Research Institute
Dear Manager,
I am writing
to express my interest in a position for Biostatistical
Analyst. I have extensive experience in both fields of
health services researches and biostatistics, where I have
worked on healthcare analysis and have developed, as well
as conducted, epidemiological and biostatistical analyses
from complex data sets. I have a passion to improve clinic
or public health and believe I will be a great addition to
your team.
One of my
advantages to the position is that I have a wide range of
knowledge from the medical, epidemiological,
biostatistical and health economics fields to the IT
industries. It will help me understanding the task, with a
particular focus on creating customized solutions to best
meet the clients’ diverse needs, and to get the
solution-oriented task or job done much efficiently and
successfully.
I used the
logical knowledge and skills to understand the data as the
key for my handling or managing the available information.
Of course, if it were an experimental design, then the
clear and logical understanding to the issues would be
essential and the cost-effective methods would be better
to be followed or selected. I have paid my attention and
my efforts on logical training during my previous work and
have my confidence in doing better in the position for
Analyst.
Moreover, my
skills in data sorting, statistic testing and financial
sensitivity analysis are very strong. I am skilled in
Statistics, included experimental designs, and
Biostatistics, included a variety of testing methods. It
could help me to exploit or interoperate the maximum value
of the data or information. On my recently data analysis
of COVID-19, based on the 2,067 million of population from
seven counties, I have found an index of ratio and
mathematical modeling for the transmission dynamics of
COVID-19 (the manuscript in PDF available to view at https://www.cnxiv.org/PDF
Ratio of COVID.pdf ).
Recently, to
meet the statistics education needs, I have written a book
of How and Why…Statistics for online download
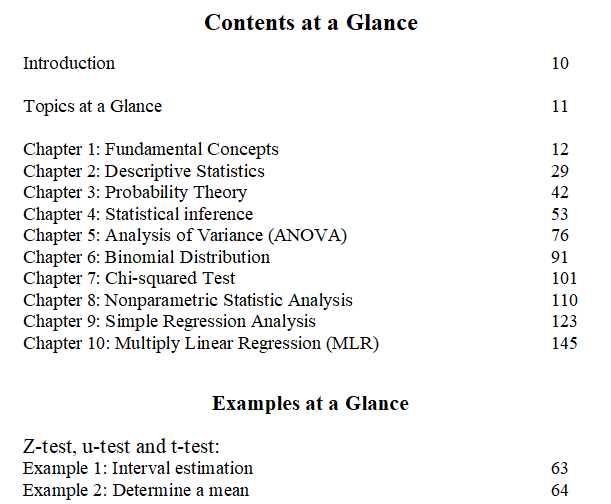
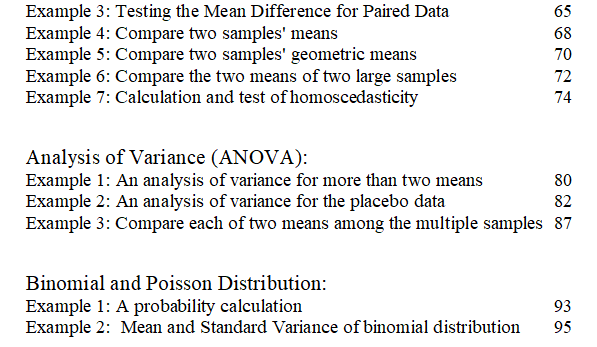
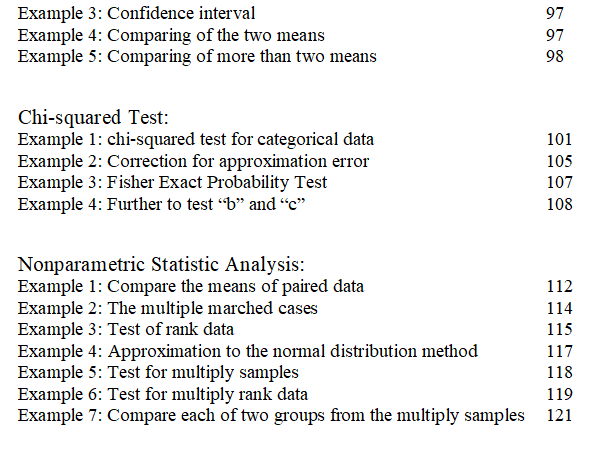
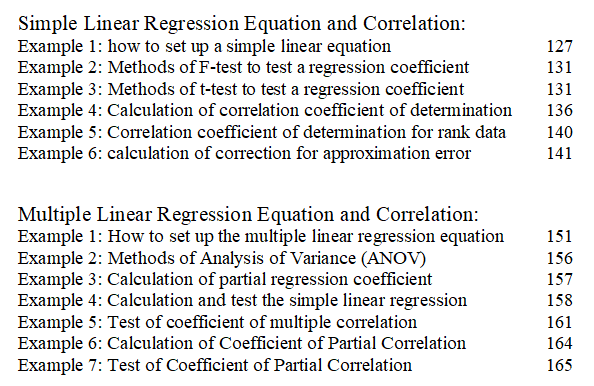
(the contents of PDF version list as following images). Meantime, I am a life-long-learner with an interest in
analytical, experimental, and theoretical statistics. I'd
like to combine my knowledge and my skills to make my
contributions to this valuable position. Even as a
volunteer, I’d like to have an opportunity to make my
contribution to BC Children's Hospital Research Institute
or other one of Provincial Health Services Authority.
Thank you for
your consideration.
Sincerely,
Charles
Cheng Xia

|
|
|
|
|
|
 |
|
|
This
PDF version is copyright
© 2020 by Charles C. X.
Copyrights
© All rights reserved. |
|
|
|
|
|
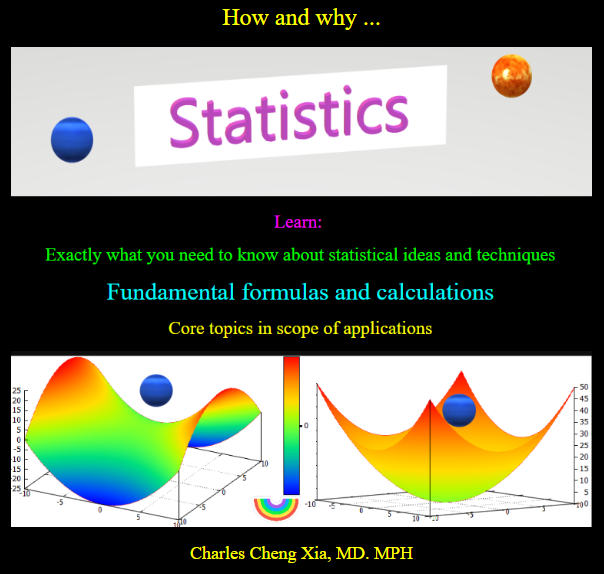
How and
Why...Statistics
by Charles Cheng Xia, MD.
MPH.

The PDF version of this
book, 167 pages of A4 size, for online download is
available.
This
book is focus on description of data and analysis of
data with help you understand and learn exactly what you
need to know about statistical ideas and techniques,
fundamental formulas and calculations and statistical
core topics in scope of applications.
The
book includes more than forty examples in explanation
and/or illustration, step by step, to let you understand
or have ideas to understand on how and why the statistic
formula and calculation be applied.
About
the Author
Charles
Cheng Xia is a statistics and health educator with his
Medical Doctor and Master of Public Health degree. His
primary research interest lies in epidemiology, health
economics and complex disease dynamics inferred from
data science and mathematical modeling.
Email: cxmail@yahoo.ca |
|
Statistics is the
bridge between the data you have and the insight you
need. The scope ranges from simple summaries and
exploratory analyses to complex modeling and hypothesis
testing.
Summary Statistics
Summary statistics
provide a snapshot of a system without attempting to
explain what's going on behind the scenes or to predict
how things might change. Presented
as tables or simple plots, these give you an overview of
the information contained within your data. Summary
statistics are ideal when you simply need to record and
report on the data you collected, whether it's a
laboratory experiment or a nationwide survey.
Exploratory Data
Analysis
Often a precursor
to more detailed statistical analysis and modeling, but
still a very valuable exercise. The book begins to
explore the relationships between the variables within
the data set, to identify patterns and trends that help
you understand what's going on.
Assumptions will
be tested to understand what sorts of processes might be
involved in generating your data. Sophisticated visualization
techniques are used to display complex relationships in
an easily-digestible manner to help you communicate the
results and understand in simple terms what's going on.
Statistical
Analysis
Statistical
analyses range from hypothesis tests to predictive
models. They are used to answer specific questions,
either about what's happening now or what might happen
in the future. They provide a detailed insight into your
data to create clear conclusions and motivate
intelligent decisions.
|
|
|
|
|
|
|
|
|
 |
|
|
 |
|
|
 |
|
|
 |
|
|
|
|
|
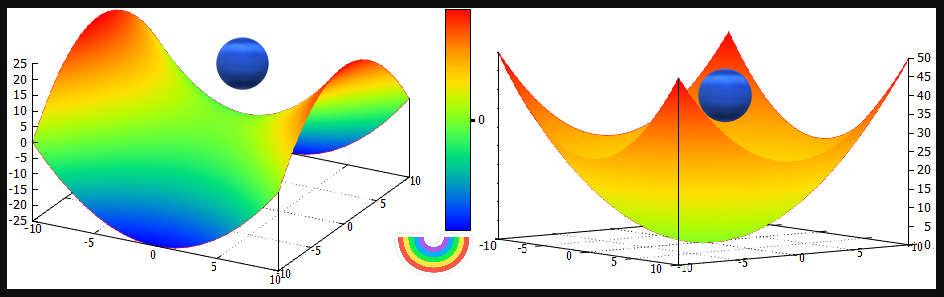
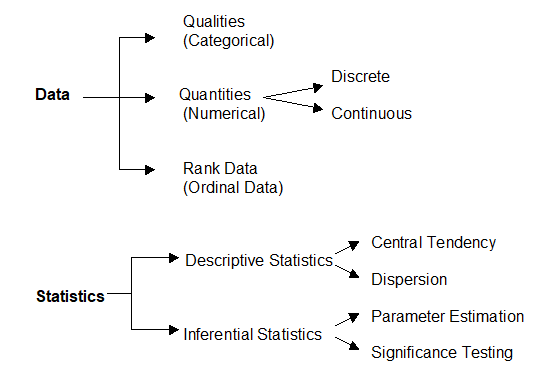
This
book is focus on description of data and analysis
of data with help you understand and learn exactly
what you need to know about statistical ideas and
techniques, fundamental formulas and calculations
and statistical core topics in scope of
applications. The book is mainly based on the
following two illustration figures to extend the
statistic contents. |
|
|
|
|
|
For
your better and/or easier understanding, this book
includes more than forty examples in explanation
and/or illustration, step by step, to let you
understand or have ideas to understand on how and
why the statistic formula and calculation be
applied.
It
is assumed that you’ve had a basic algebra
background and can do some of the basic
mathematical operations and understand some of
basic notation used in algebra like x, y,
summation sign, taking the square root, squaring a
number, and so on.
|
|
|
|
|
|
|
|
|
|